The Designest may receive compensation from companies, products, and services featured in this publication. For more details, please refer to our Affiliate Disclosure page.
Heard the proverb “meet on the clothes — see off on the mind”? Not only does it relate to people, but presentation design as well. That’s the reason why the design is one of the most important parts of your brand development, therefore you should consider all the details. And that’s the moment you’ll need an infographic — a great way to capture the desired attention for your product as it is a visually attractive representation of the information you want to convey to your customers.
Of course, creating your own infographic from scratch can take an enormous amount of time, especially if you are new to this, so you’ll need an easy-to-use yet powerful infographic maker app that will help you to present all the data in a neat and effortlessly legible manner.
The popularity of infographic creators is easily explained: when potential customers want to learn more about a brand or a company, they look for quick access to all the information they are interested in. The easiest way for companies to provide the readers with this information is to create an infographic. So, after a long search, we found 20 best infographic maker apps, so you can not waste your time on this, just choose the most suitable software for your needs and get to work right away.
Ease of Use: Easy | Price: Free
Paid Options
- Canva Pro $12.99/mo or $119.99/yr (free trial available)
Reasons to Buy
- Powerful tool with thousands free infographic templates and over 100 design types
- Opportunity to invite members to your team and collaborate with them
- 5GB of cloud storage
Reasons to Avoid
- Only works online
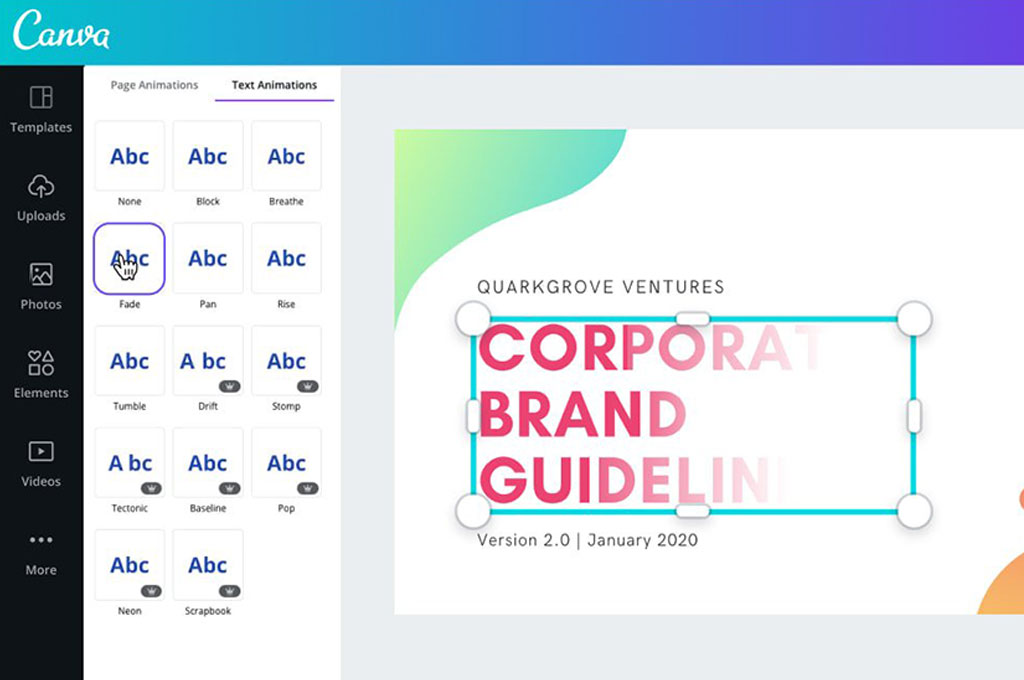
Canva is one of the most popular app for designers these days. It is an easy-to-use yet powerful tool that suits any purpose of creative design projects: from presentations to brochures and many more besides. It provides users with thousands of professional templates, images and other high-quality elements that will be a great starting point for bringing all the best ideas to life. It features a free infographic maker (that includes hundreds of free design elements and fonts at your fingertips) and will be a great app to start infographic creation with. Also, it has a Pro trial period.
Moreover, Canva has full instruction on how to create your first infographic from the outset. Using this software, you’ll be able to finish your work in minutes and get the result that will help promote your brand as all the data will be structured nicely and the readers will learn everything they need to get to know your company more closely.
Ease of Use: Easy | Price: Free
Paid Options
- Adobe Premium $9.99/mth (30-day free trial available)
Reasons to Buy
- Perfect for beginners who never worked on infographics
- Available on web and mobile
- Thousands of unique templates
Reasons to Avoid
- Best looking templates for infographics are available only with Adobe premium
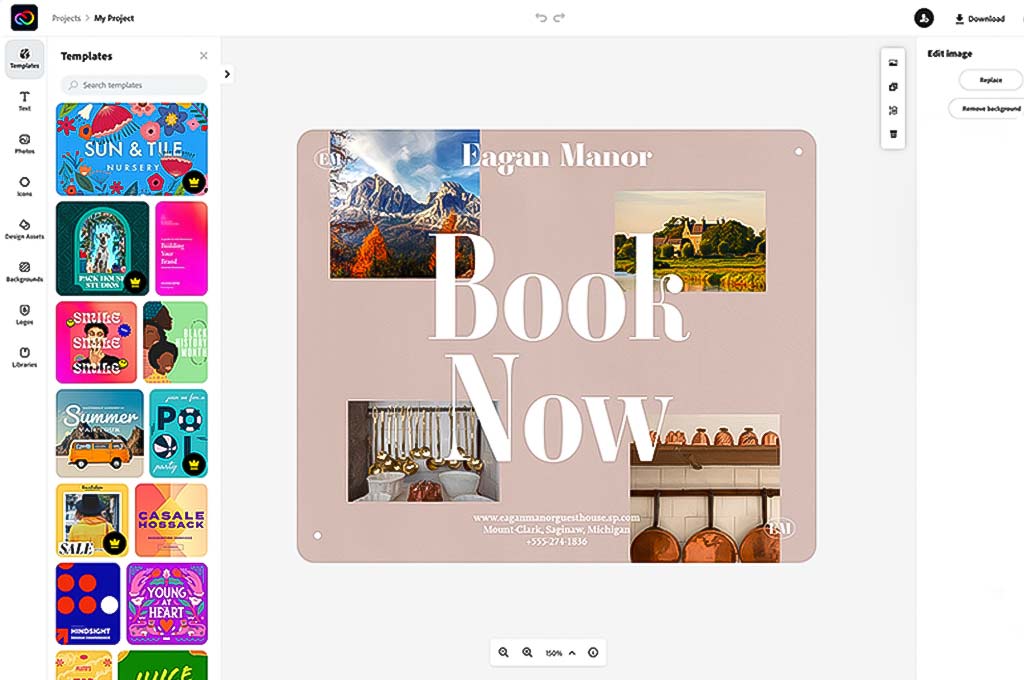
If you need to create infographics easily and quickly for social media, Adobe Creative Cloud Express (formerly Adobe Spark) is one of the most suitable apps around. This infographic maker provides you with over 10,000 templates to choose the best ones for your design and thousands of free resources you can use to add spark to your project. There’s a free plan, but to unlock all the features available, you’ll need a premium subscription (that has 30-day free trial).
Creative Cloud Express is super simple to use as it has a drag-and-drop editor, even for beginners in the design field. Search through the endless infographic templates to get the one suitable for your ideas the best, and start editing right away. There is an opportunity to add your own background, an image, change the text, introduce an icon and, if you have one, include your logo. When your work is done, the infographic maker lets you resize for the social platform you need with a single click, then download.
Ease of Use: Easy | Price: Free
Paid Options
- Premium $16/mth
- Business $39/mth
- Enterprise $499/mth
Reasons to Buy
- Online graphic maker is easy-to-use
- 7500+ profesionally designed infographic templates
- The opportunity to download and share your infographics or invite your team to collaborate
Reasons to Avoid
- Few fonts
- Many features only come with paid subscriptions
Venngage is one of the most popular infographic maker apps that many designers give preference to. The reason behind their choice is simple. With a vast range of creative templates, in fact, over 7,500, it provides users with the opportunity to create everything they imagined. Also, it’s easy to use and has a handy image search feature, which allows you not to waste much precious time finding and adding images to your infographics.
Although there’s a massive amount of free features available, such as font upload and the ability to export in Powerpoint and PDF, there are many resources that are only available as part of a Business account. There is a great difference between what you get from a Premium and the Business plans from this infographic maker. The Business plan implies more team members you can share the designs with, extended number of uploads per month, HTML and PowerPoint Exports, phone support and priority email & chat support.
Ease of Use: Easy | Price: Free
Paid Options
- Pro $10/mth
- Team $20/mth
Reasons to Buy
- Free plan allows 3 downloads per month
- 6,000+ templates and 5,000,000+ HD photos and graphics
- You can use your own company logo/graphics
Reasons to Avoid
- The app is browser-based so you need internet to be able to work
Snappa is a highly-rated graphic software that enables you to create attractive, eye-pleasing, beautiful infographics immediately catching the readers’ attention. The great advantage of this infographic maker is that it is absolutely beginner-friendly, so you can choose it even if you aren’t so experienced in the design field. Being super easy to use, it supplies you with an immense amount of pre-made infographic templates and a huge library of high-res images (more than 4,000,000 exactly).
Snappa is an infographic maker that has many helpful features: with just one click you can remove the image background, add a text effect (the app provides you with them, too) or graphics. Also, you can share the result on social media right from the app. There’s a free plan (it implies one user, over 6,000 templates, and three downloads a month) and pro plan options from $10 per month, offering more professional features, such as custom font uploads and removing image backgrounds.
Ease of Use: Easy | Price: Free
Paid Options
- Pro $14/mth
Reasons to Buy
- Unlimited access to infographic templates, images, illustrations and icons
- Opportunity to download files as PNG, PDF, PPT
- Collaborating and commenting feature is available
Reasons to Avoid
- Free plan implies watermark on infographics
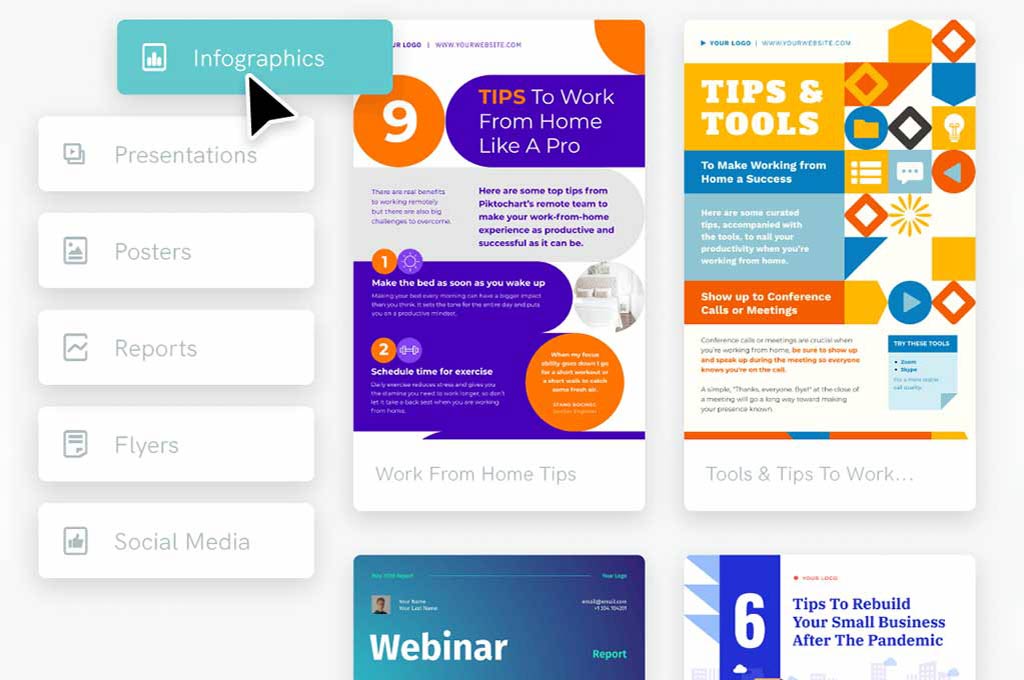
If you are looking for an infographic maker software that supplies users with a great number of templates, icons, and images, Piktochart is the app worth your attention. It takes out the legwork of creating an infographic by providing you with every resource you may need, and even the free plan allows you to bring to life your creative fantasies.
After uploading your stats, you’ll be able to choose an infographic template, configure the color scheme and the whole layout according to your likings. Once you start working with Piktochart infographic maker, you’ll see that infographics can be the art themselves, as this program has everything to create a real masterpiece that will capture customers’ attention. The useful feature of the app is that it allows you to collaborate with your colleagues and work together on the infographics(you’ll also be able to communicate in the comment section). There are two main plans and pricing options for students, enterprises and non profit organizations, including a free account that gives you an opportunity to make up to five visuals, though you’ll need to pay to get rid of the Piktochart watermark.
Ease of Use: Easy | Price: Free
Paid Options
- Pro $15/mth
- Business $29/mth
Reasons to Buy
- The infographic maker suitable for seasoned designers and total beginners
- Allows to package your info into highly engaging, highly impactful presentations with amazing array of fonts, icons and images
- Great number of fonts, high-quality icons and images
- Opportunity to create a video or an animated infographic
Reasons to Avoid
- Most of the resources are available in the paid plan only
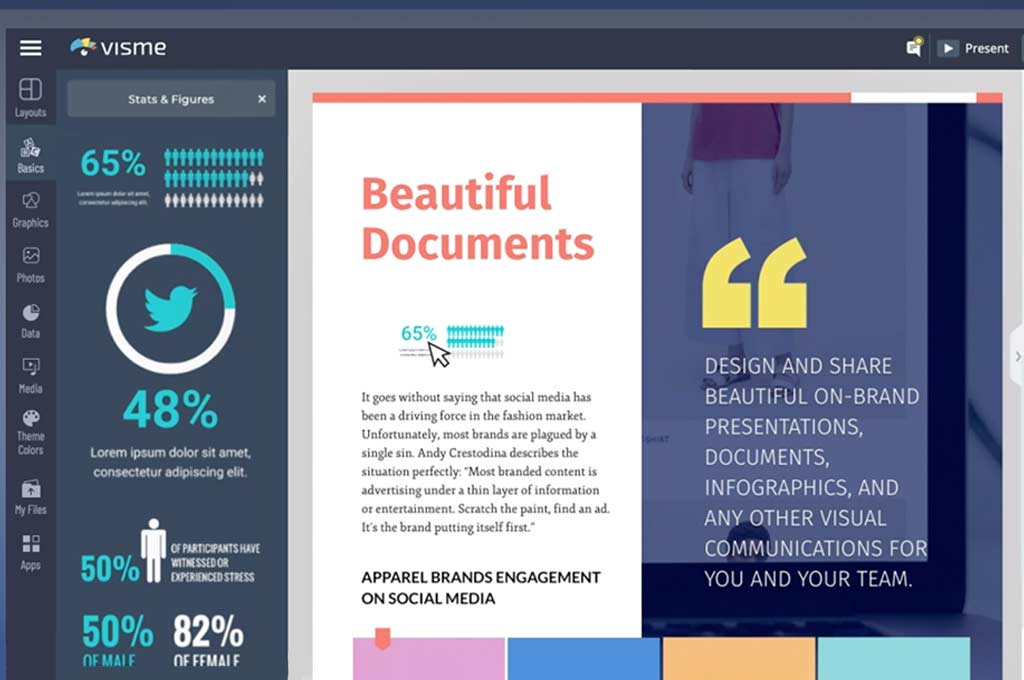
Visme is the software that will help convert your information into an attention-catching infographic. This app provides you with more than 100 fonts, thousands of high-quality icons, and millions of free images. The advantage of Visme infographic maker is that there is a possibility to include video or audio in your presentations (including the opportunity to create a voiceover directly in the program, that is a handy feature). It also allows you to animate the infographics to attract readers’ attention and make the data easier to understand.
A vast library of pre-made resources of the Visme app that can be easily found, dragged and dropped into the right place helps users create the infographic in no time and makes this software easy to use even for those who are new to the graphic design field. There is a free plan of Visme that can serve to get you to know the app. The pro plan costs $15 a month.
Ease of Use: Intermediate | Price: Free
Paid Options
- Pro $19/mth
- Business $67/mth
- Team $149/mth
Reasons to Buy
- Ready-to-use designer infographic templates
- Collaborate in real-time
- Share and publish online
Reasons to Avoid
- No possibility to download on the free plan
Infogram is a great infographic maker tool with a wide variety of resources included: charts, graphs and maps. Plus, it enables you to upload your video and pictures if so required by the project. Infogram is in an Excel-style tool, so you enter and edit the information that makes up the infographic, the contents of which will be reflected in your design. The program will update the scheme right away to represent your data.
There are different ways of your further actions: after you have finished your work on the infographic and the result satisfies you ultimately, you can either publish it on the Infogram website or share it on any social media you’d like to. The basic plan of the infographic maker is free and supports up to 10 projects and 13 maps types, while paid plans start from $19 a month and enables you to create more projects, gives the acces to premium templates, advanced image editing features and many other useful features.
Ease of Use: Easy | Price: From $2/mth
Paid Options
- Student $2/mth
- Individual $4/mth
- Business $5/mth
- 7-day free trial available
Reasons to Buy
- An easy to use app for creating infographics, beginner-friendly
- A big amount of assets from pro designers
- Affordable
Reasons to Avoid
- No free plan
- Hard to find exactly what you are looking for
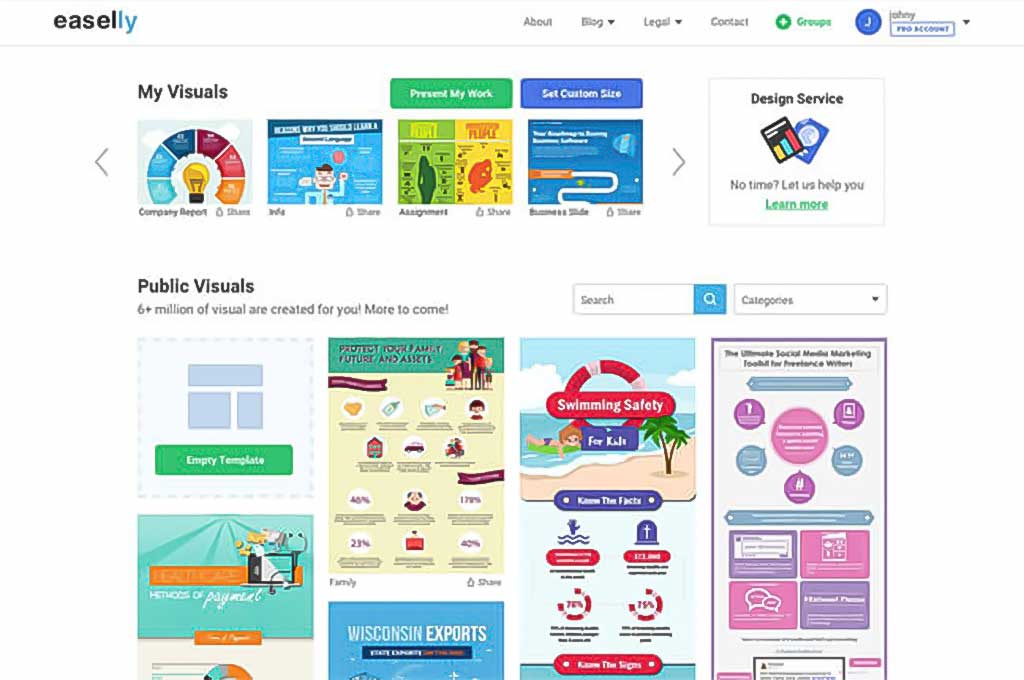
Easel.ly is a web-based infographic maker that provides you with a vast range of any resources you may need to create the perfect presentation. After subscribing to the app, you get access to its library with shapes, arrows, connector lines, and easily customizable templates for making infographics (with limitations, though, as most editor tools are available with more expensive plans). Speaking of customization, the plus of Easel.ly is the opportunity to work with texts and change them as much as you need to get the result of your dream: choose different typefaces, text styles, colors, and sizes. Just one touch is all you need to upload your own graphics and place them where you want.
To get to know the infographic maker, you get a free trial period with a money-back guarantee. This option includes 60 images and 10 fonts. A paid plan, starting from $4, brings you much more professional resources, boosts security options, and if you have any questions, design help whenever you need it.
Ease of Use: Easy | Price: Free
Paid Options
- Basic $4.99/mth or $48/yr
- Plus $5.99/mth or $84/yr
Reasons to Buy
- Simple to use
- Affordable pricing
- Powerful tools for creating infographics
- High-res PNG and PDF exports
Reasons to Avoid
- The best templates aren’t available with the free plan
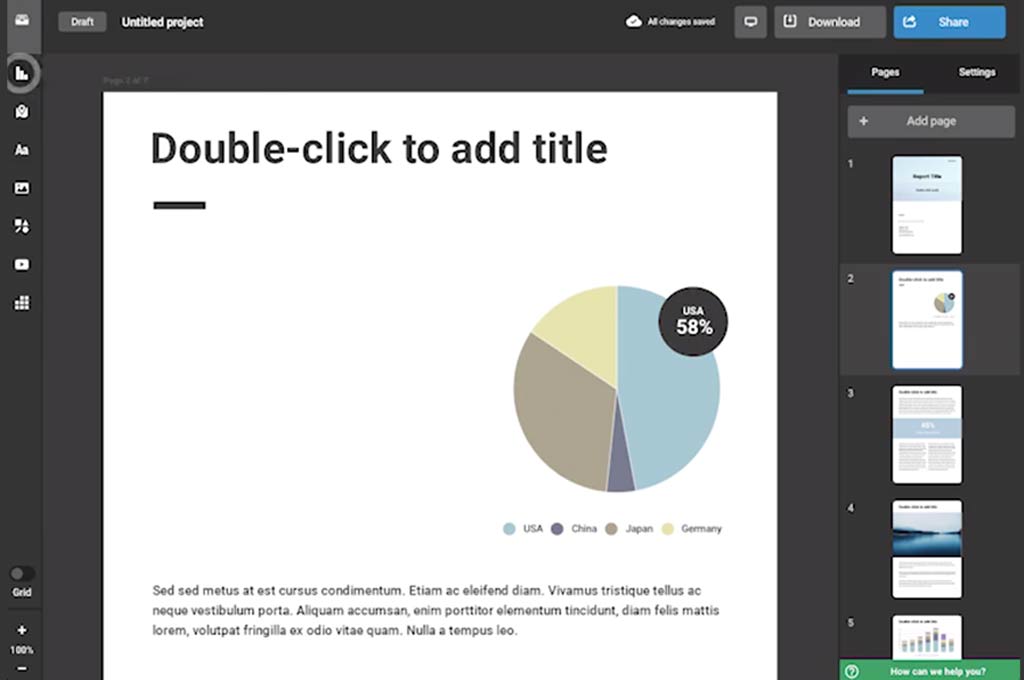
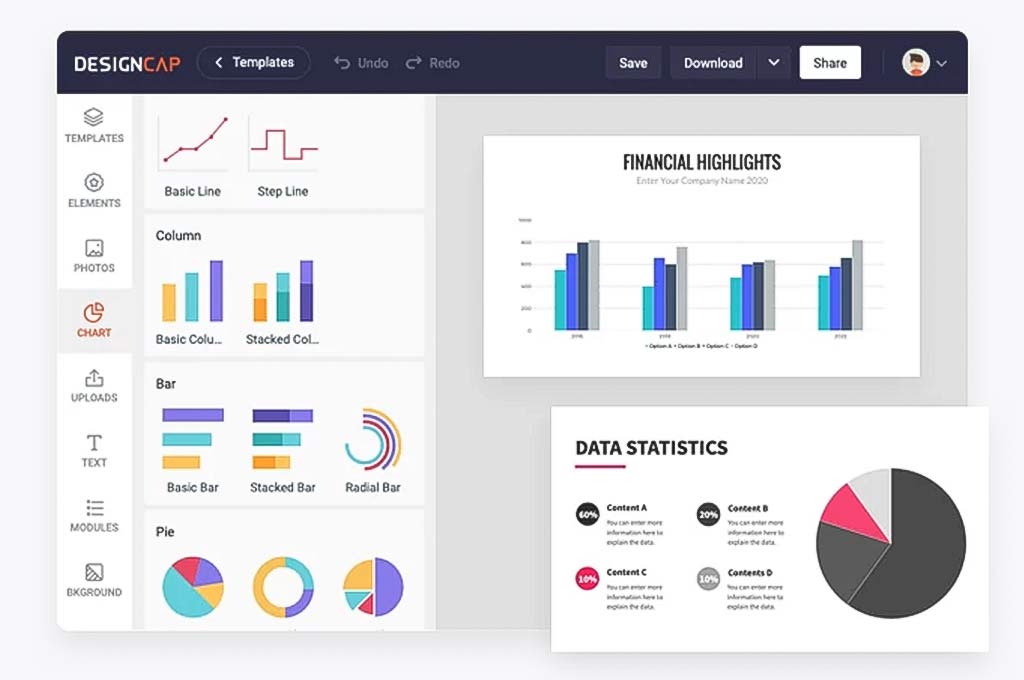
DesignCap is an online infographic maker that is a perfect app for beginners as it’s easy to use yet has all the needed tools to create an attention-catching presentation. The software offers its users a vast range of professionally pre-made templates, although the nicest ones are only available with the paid plan. Also, it provides illustrations, icons, stock imagery, and, most important, you’ll be able to upload your own resources you want to use in the infographic and save up to five designs.
The free plan of this infographic maker allows five JPG exports, but you can upgrade to a Basic plan ($4.99 per month) or plus plan ($5.99 per month). These plans give you an opportunity to get unlimited templates, stock icons and modules and high-res PNG and PDF exports.
Ease of Use: Easy | Price: Free
Paid Options
- Student $1.25/mth
- Edu Pro $4.99/mth
- Master (education) $20.82/mth
- Pro (company) $7.49/mth
- Master (company) $20.82/mth
- Team $79.15/mth
Reasons to Buy
- A great amount of powerful tools
- Pre-made templates, graphs & charts
- Collaborative edition for working on infographics together
Reasons to Avoid
- The majority of resources are available with paid plans only
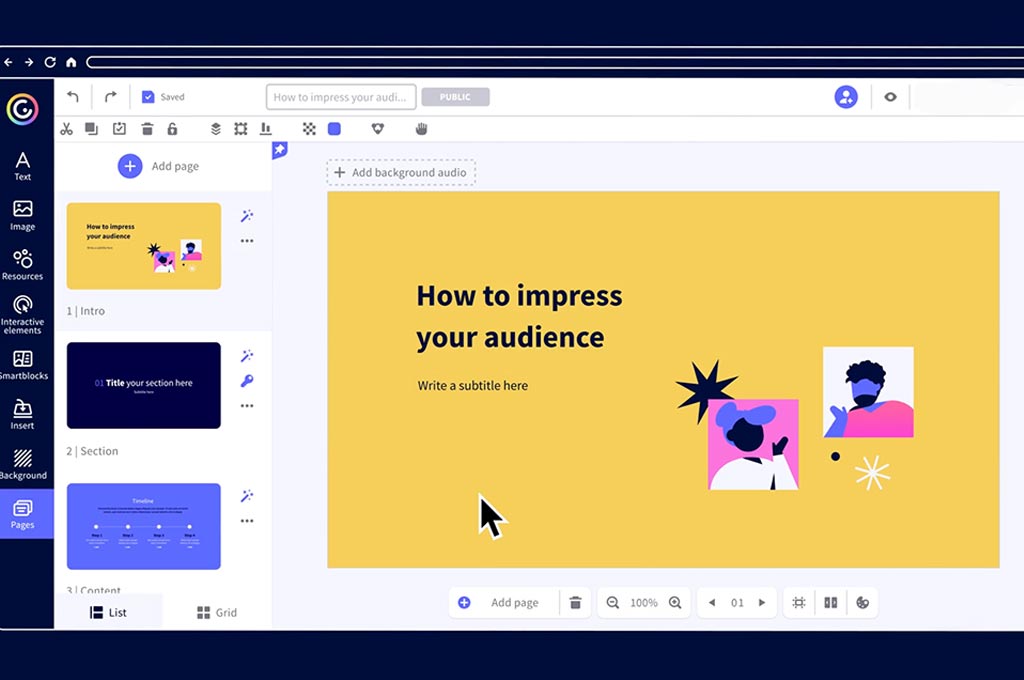
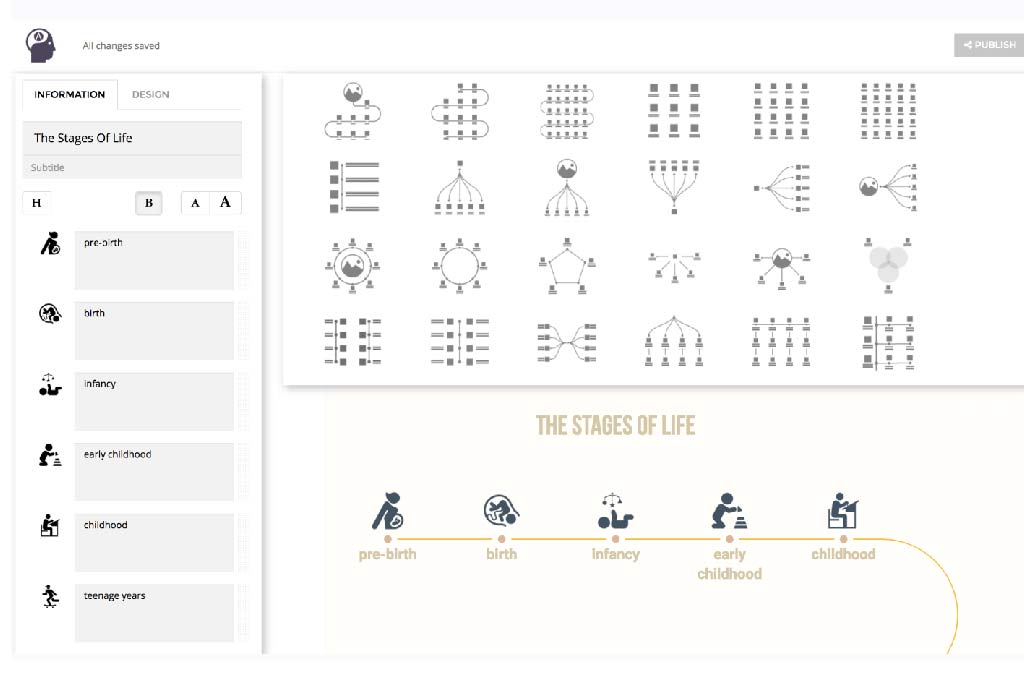
Genially is an infographic maker app that enables users many customization opportunities. It offers video presentations, dossiers, e-posters and quizzes, etc. Aided with visual counterparts, the communication in this program is easy and makes your work more productive: just put your ideas in crystal clear form and your colleagues will be able to add their comments to come to a common decision. Genially is also a good app for students and helps create interactive presentations with video, audio and slideshows.
The significant advantage of this infographic maker is that it allows the creation of quizzes and maps without any hassle. This feature is especially useful for those craving their website or blog to look more attractive and enrich the info section with advanced features. Users can start with selecting the industry and choose from a list of options that range from creating presentations, stories, guides, etc. As the interface is plain and simple, there is no need to have any advanced skills to work with Genially.
Ease of Use: Intermediate | Price: Free
Paid Options
- Junior $7/mth
- Senior $15/mth
- Pro teams $65/mth
Reasons to Buy
- Free version allows you to pay on-demand for extra assets that makes creating infographics process easier
- Paid versions include Creative Commons licenses
Reasons to Avoid
- Watermark on free version
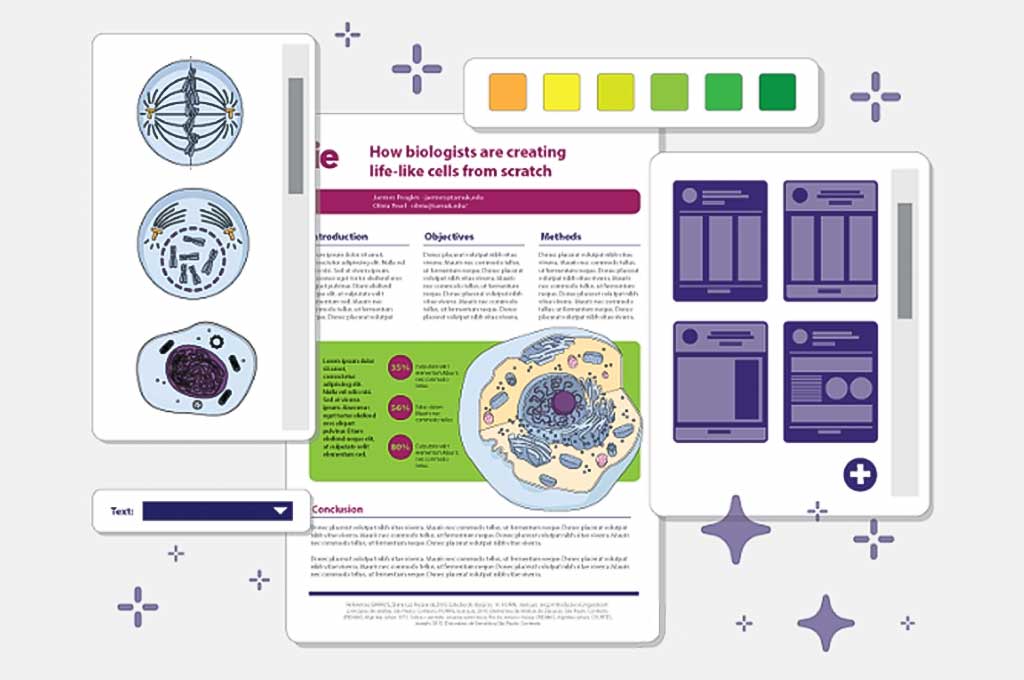
The main specialization of Mind the Graph is scientific infographics, but you can also use it for any other purpose, for example, to create illustrations outside of scientific papers to present your information in the best light. The online infographic builder offers different layouts that you can use to design various kinds of visual illustrations straight out of the box.
This infographic maker provides you with countless icons that help liven up a wordy journal paper as much as for non-scientific purposes, so you can take advantage of the built-in online editor and updater to make any changes to create the result you want. The free version of the software works perfectly to get to know the app. The paid versions start as low as $5 for the Junior version aimed at undergraduate students and occasional users.
Ease of Use: Intermediate | Price: Free
Paid Options
- Ultimate $49/mth
- Teams $2500/yr
Reasons to Buy
- Free plan offers over million pictures, videos and animations to use
- Easily made specialised video infographics
Reasons to Avoid
- Watermark on free plan
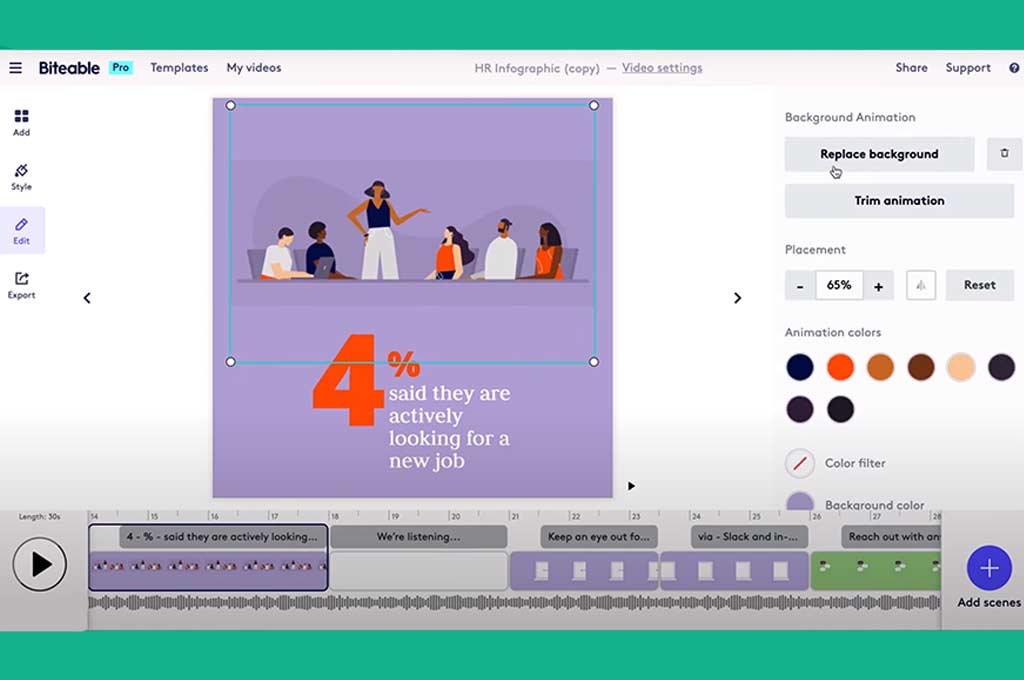
Biteable is not a regular infographic maker app. It offers users the opportunity to create high-quality video infographics that can be easily shared on all social media. To make your presentations sing, Biteable provides the possibility to add soundtracks, as well as deliver engaging image assets for creatives to work with.
This infographic maker’s advantage is that it removes the barrier to entry, the problem so often stopping people from using videos to their full effect. And, of course, it has a great amount of pre-made scenes and designs (that can be used even on a free plan). Moreover, you can make and share up to 10 video projects (that will have a Biteable watermark, though). There are also paid options that you can get by subscribing to pro plans that start from $19 per month.
Ease of Use: Easy | Price: Free
Reasons to Buy
- Absolutely free
- The service is available for all Gmail users
Reasons to Avoid
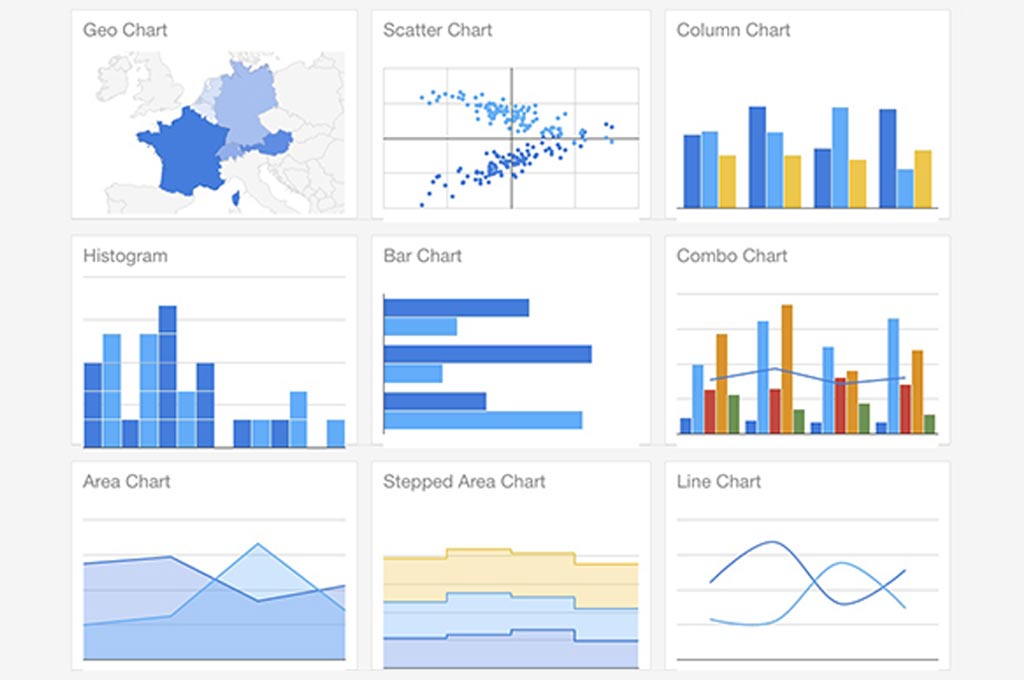
- Supports charts only
Google’s charts was created for creating graphics, but still it is suitable for all projects. The software is powerful yet simple to use — and, the most important, in this case, it’s a completely free infographic maker tool. You can choose from a wide variety of charts and configure an extensive set of options to perfectly match the look and feel of your website. By connecting your data in real-time, Google Charts is a straightforward infographic maker for your website.
The software is highly customizable: if the charts you found in the library don’t suit your ideas, you can create your own one. Also, you don’t need any plugins to work from different devices: cross-browser compatibility (adopting VML for older IE versions) and cross-platform portability to iOS and new Android releases. Even if you are completely new to the app, it won’t be a problem to learn how to use it — it has detailed instructions on how to make infographics.
Ease of Use: Intermediate | Price: From $7.99 mth
Paid Options:
- Basic $7.99/mth or $72/yr
- Pro $12.99/mth or $120/yr
- Business $23/mth or $228/yr
- (7-day free trial available)
Reasons to Buy
- Rich library of top-tier fonts
- Customisable
- Primo effects, templates, and touch-up tools
Reasons to Avoid
- Not a dedicated infographics tool
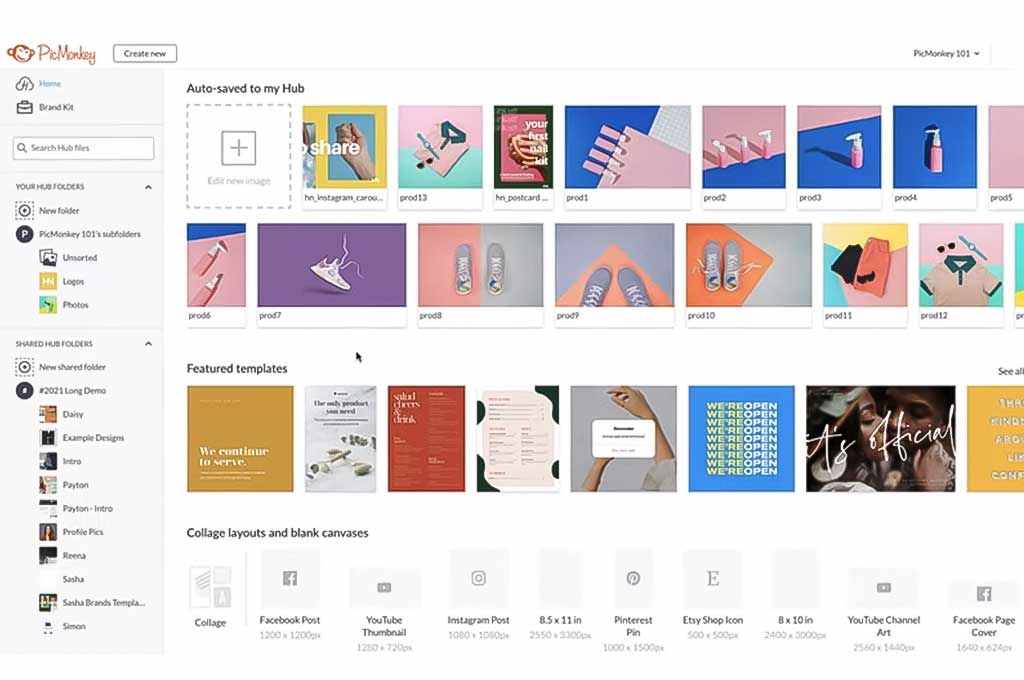
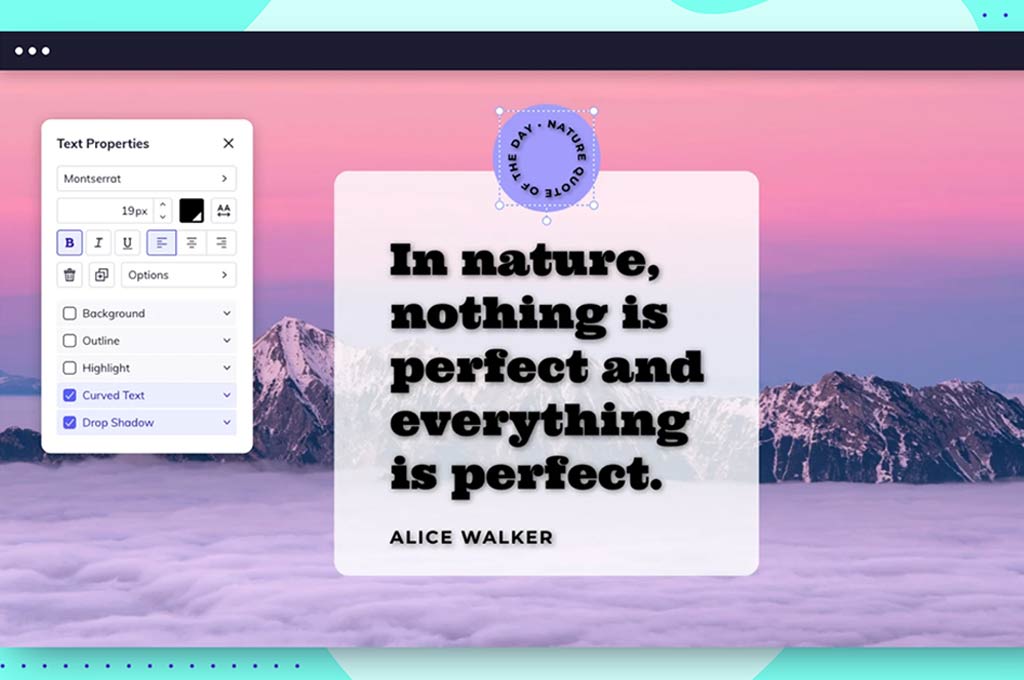
Create an infographic that is both informative and attractive with PicMonkey’s powerful builder, templates, and online design tools. This app is, first of all, an online image editor, though it has a whole section dedicated to designing and creating infographics. For everyone new to the infographic maker and wanting to know more about it, there is a selection of tutorials that is there to help you out so you can start working like a pro. The lessons are focused on how to tailor the infographic to share it on different social media how to use grid theory to create an attention-catching design.
You can start with pre-made templates and when you want to stretch your design muscles, you can use feature-rich tools to make custom images from scratch. The plan price starts from $7.99 per month, but you’ll be offered a seven-day free trial to get to know the program.
Ease of Use: Intermediate | Price: From $39/mth
Paid Options: (7-day free trial available)
- Pro $39/mth or $351/yr
- Expert $69/mth or $621/yr
- Business $300/mth or $2,700/yr
Reasons to Buy
- Feature-heavy
- Intuitive work
- Vast range of icons
Reasons to Avoid
- There is no free plan and paid plans are pretty expensive
Adioma is an infographic maker that provides a vast range of pre-made designer templates. After you choose the one that suits the ideas the most (the timeline, cycle, or grid), the infographic will be built by itself around the text you supply. In case of adding or removing the data, the graphics adjust to all changements, so there is no need to do it by hand and waste time realigning everything. Also, there is a template-switching feature that allows you to compare how the same data would look in different formats and you can choose the one to your liking.
Adioma infographic maker not only offers a huge number of templates, but it also has a rich library of icons (and you can upload your own ones as well). The more expensive options include improved download options, an expanded resource library and the ability to upload more of your own content. The prices start from $39 per month, but you can try it for free with a one-week trial.
Ease of Use: Intermediate | Price: Free
Paid Options:
- BeFunky plus $9/mth or $59.88/yr
Reasons to Buy
- Various photo editing tools
- Smart editing tools
- Photo filters and 190 effects available
Reasons to Avoid
- The majority of features are only available on the paid plan
BeFunky is an online graphics editor that was designed to edit and correct your photos with the possibility of applying a variety of high-quality effects and filters. You can use all these resources to create infographics as well. In addition, the editor has the ability to add text to your images, as well as a great number of different frames. Registration is not required to get started, just click on the Get Started button and upload the data you want to put in your own infographic.
In total, there are about 190 effects in this infographic maker, some of which are available only after purchasing a paid account (prices start from $9), but free ones will be enough to create an eye-catching and informative infographic. Almost all effects can adjust additional parameters, so you can accurately achieve the desired result.
Ease of Use: Intermediate | Price: Free
Paid Options:
- Team+ $9/mth
- Business $17/mth
Reasons to Buy
- Full template library
- Collaboration with your team is available
- Flexible tool
Reasons to Avoid
- The best resources are available in paid plans only
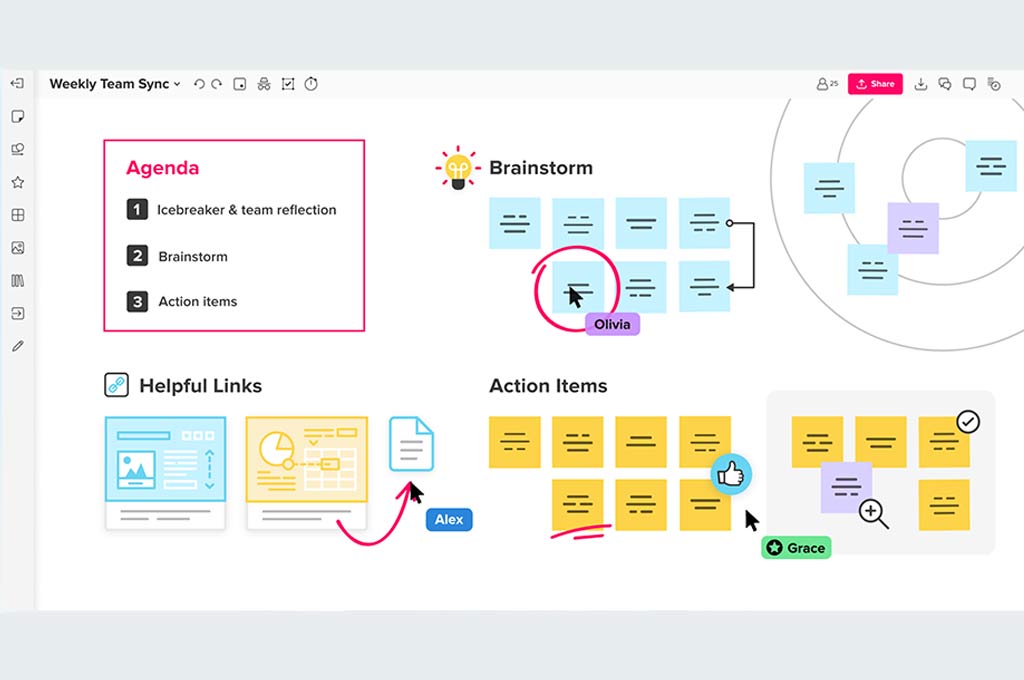
In the first place, Mural is a software with a neat design used by teams for project management, but it’s also can be used as an app to create infographics. And, of course, you can connect both its features for your work. Mural helps colleagues collaborate more productively and ideate with imagery. The program enables you to express your ideas with smart inking on the Windows app, draw for a full whiteboard experience and connect with your team members, sharing sticky note feedback with them. This way, everyone will be updated with all changements of the project.
The Mural infographic maker is a good choice for teams that look for an app to collaborate and share the information in. Moreover, the infographics made in this builder look eye-pleasing and are informative and easy to understand. The prices for pro plans start from $9 per month.
Ease of Use: Easy | Price: Free
Paid Options:
- Basic $10/mth or $120/yr
- Starter $19/mth or $228/yr
- Pro $49/mth or $588/yr
Reasons to Buy
- Colaborating with your team in real-time is available
- Video editor is available
- 5 uploadings per month
Reasons to Avoid
- The watermark on the free plan
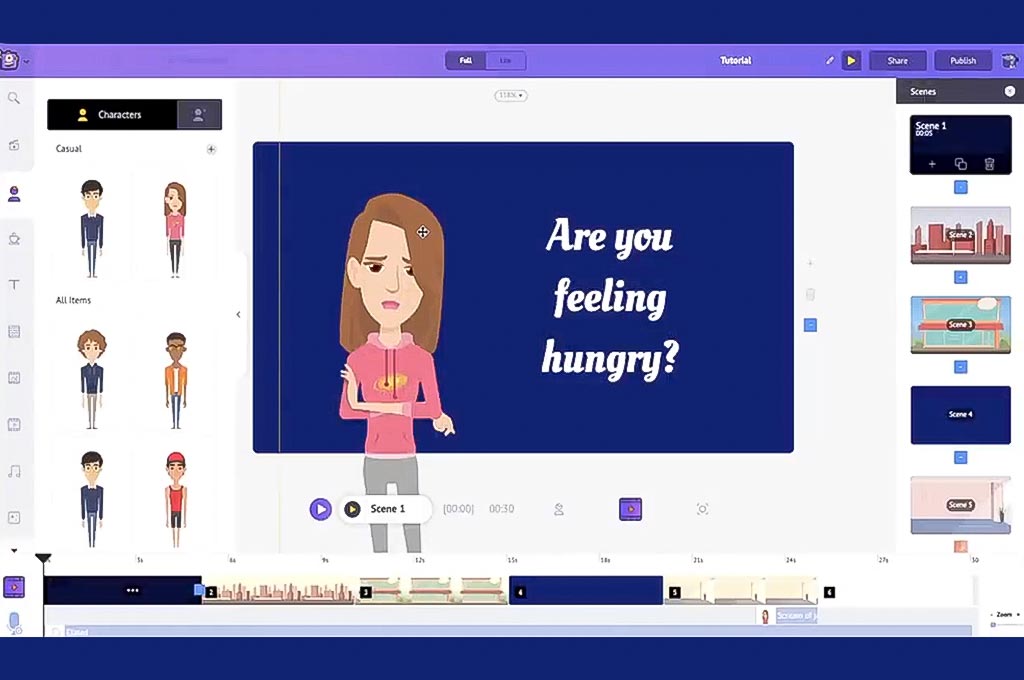
Animaker is a service that allows you to create animated infographics using various animated characters. This tool will help your data start speaking. Use that to your advantage and tell all the information through stories. There is a free plan that enables video length for up to 2 minutes. If you need a longer video, you can create it by combining several clips into one.
The service provides you with the possibility to download and use custom media content in your work. There is a limit on the size of the uploaded file — it should not exceed 5 MB. You can use photos, images, sounds and music. It is possible to record comments to scenes using a microphone directly on the service. This feature offers to voice the video that you created. There is a possibility of starting work from scratch or using the pre-made resources as the service authors have prepared many thematic templates.
Ease of Use: Easy | Price: Free
Reasons to Buy
- Free
- Easy to use
- Doesn’t need any mapping service to work
- JavaScript-based and Python tools available
Reasons to Avoid
- Need internet connection to work
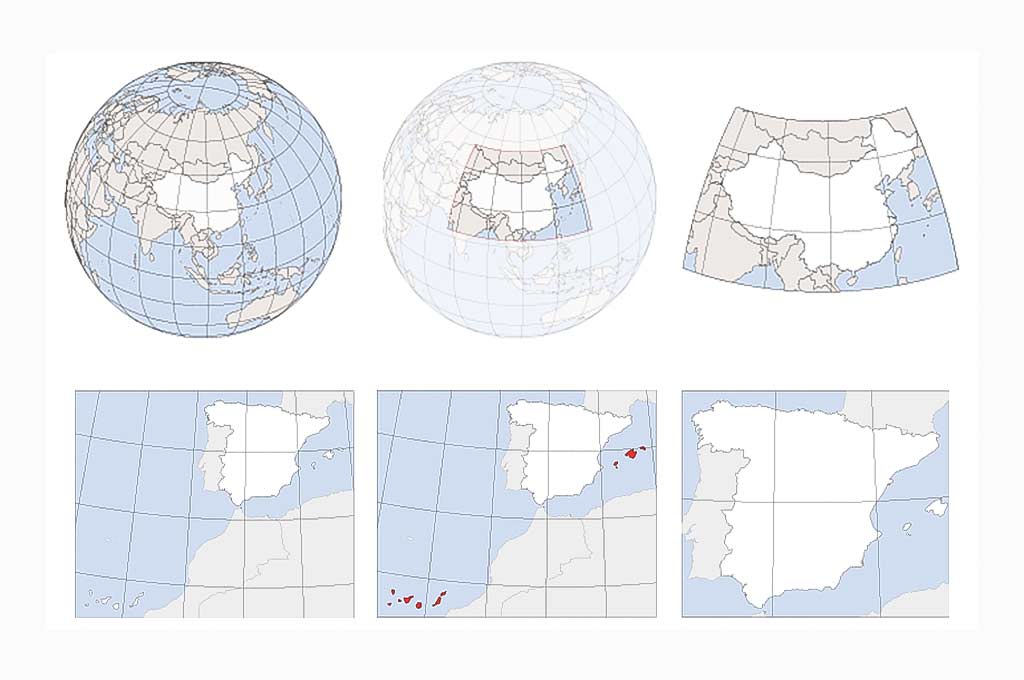
The Kartograph is a free map-based infographic maker that makes interactive and illustrative maps. This app was created for the needs of data journalists and designers. Kartograph is a lightweight and simple framework, as it doesn’t need Google Maps or any other mapping service to work. The application itself has a vast range of map types, so you can find the one that suits your needs the most.
It has JavaScript-based and Python tools to create the map you require. The Python infographic maker’s library generates compact and beautiful SVG maps, while the JS library helps you create interactive maps that run across all major browsers with no problems. The Kartograph has many advantages: it is easy to use (you can make an interactive map within minutes), runs 100% stand-alone, so no server is needed, and it gracefully degrades to Internet Explorer 7+.
Frequently Asked Questions
Making beautiful infographics on your phone is just as easy as making it on any other device. You don’t even have to pay for premium plans on various software since many of them have a mobile version of the site and the steps you take while working will be just the same. For example, you can choose Canva or Adobe Creative Cloud Express if you often need to create infographics on different gadgets. Both tools work on Android and iOS.